You can now monitor real-time data fluctuations from field devices through the data logger with greater precision and detail.

What Has Changed in the Data Logger Interface?
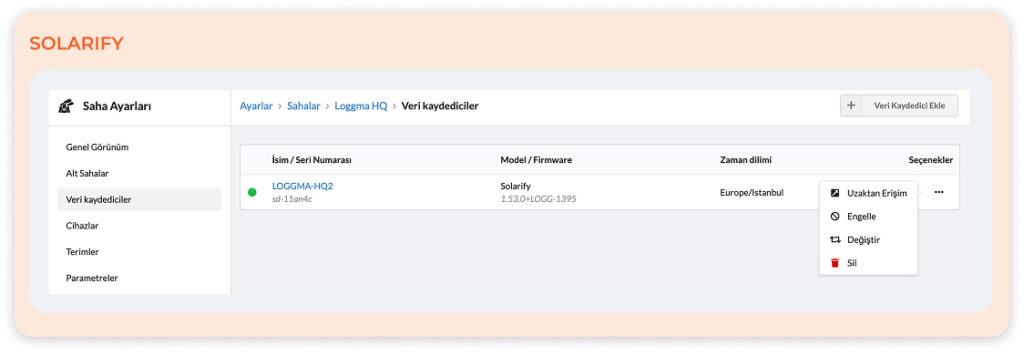
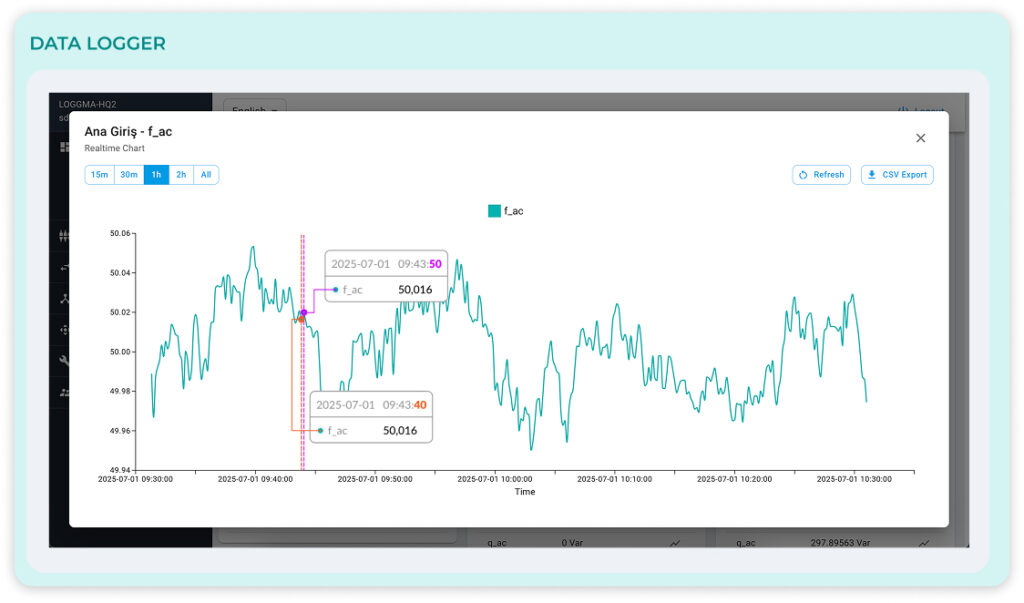
With the new update, you can now view, generate, and export graphs based on second-by-second readings directly from the LOGGMA Data Logger interface — in addition to your existing remote access capabilities.
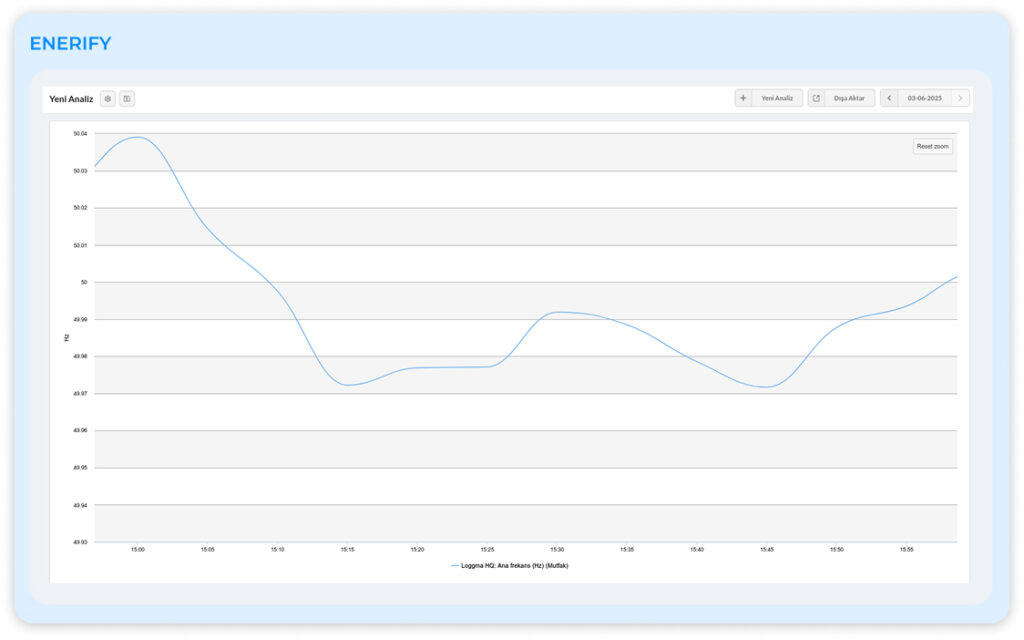
Previously, portal graphs were generated using 5, 10, or 15-minute averages, meaning a one-hour graph contained only about 12 data points.
With this update, the Data Logger now allows for high-resolution analysis of up to 3,600 real-time data points per hour, enabling much more detailed and precise monitoring of instant field values.


What Does This Enable?
- Accessibility and reporting of real-time fluctuations
- Detection of sudden spikes, short-term issues, and micro-level variations
- High-precision observation of system behavior in the field