Categories
Innovations

Tolerance-Based Alarm Model for Inverter Production Performance Now Available in Solarify!

More flexible and reliable alarms are now available for your energy production monitoring!

We’ve added Tolerance and Threshold Value parameters to the inverter production comparison alarms on the Solarify & Enerify platforms. This enables more accurate, customized, and scenario-based tracking across your sites.

THRESHOLD (%)

Determines the minimum inverter production value required to be included in the comparison.
For example: With a 10% threshold and a 100 kW inverter, if the production is below 10 kW, the alarm will not be triggered.
This prevents unnecessary alarms during low production periods (e.g. mornings/evenings).

Tolerance-Based Alarm Model for Inverter Production Performance Now Available in Solarify!

TOLERANCE (%)

Defines the acceptable difference between the production values of the inverters you want to compare.
When the defined percentage is exceeded, the system triggers an alarm.
This way, small and insignificant fluctuations do not create unnecessary alarms — only truly critical deviations are reported.

Tolerance-Based Alarm Model for Inverter Production Performance Now Available in Solarify!

BENEFITS:

  • Fewer unnecessary alarms
  • Detection of critical deviations
  • Flexible and customizable structure
  • A more reliable performance view

For more information, feel free to contact us!

Categories
Innovations

New Feature on Solarify & Enerify: View Your Subscriptions Directly Through the Portal!

You can now access all your subscription information from a single screen!

New Feature on Solarify & Enerify: View Your Subscriptions Directly Through the Portal!

Through the portal, you can:

  • View your subscription plan
  • Track start and end dates
  • Instantly check your subscription status (Active / Demo)

This makes managing your subscriptions much more transparent, practical, and accessible.
Log in now to review your subscription details for each of your sites.

For more information, feel free to contact us!

Categories
Innovations

Define and Characterize Your Energy Consumption Patterns!

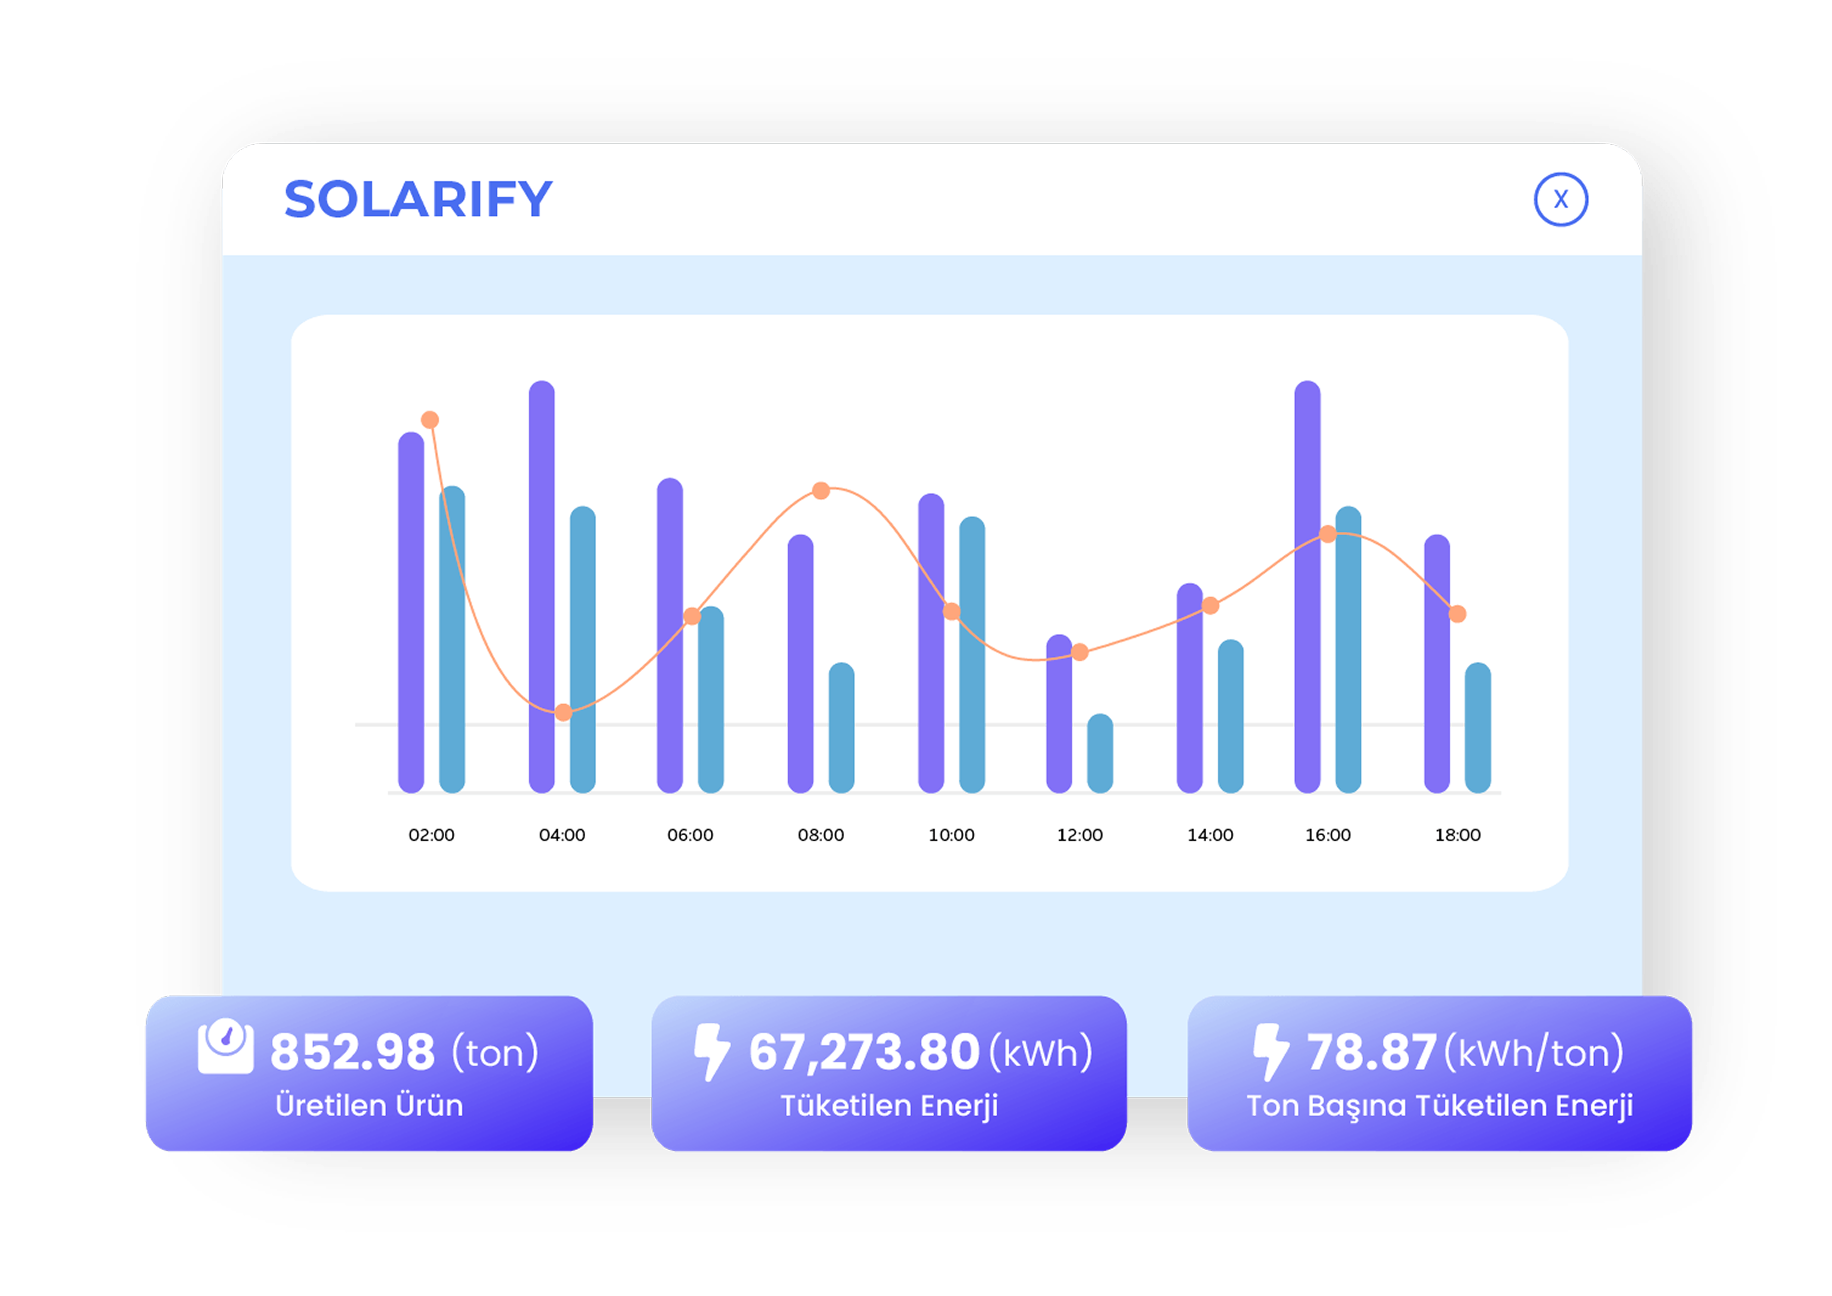
With the Enerify Efficiency Page, analyzing your energy consumption in detail is now easier than ever.

Define and Characterize Your Energy Consumption Patterns!

Characterize Your Energy Consumption

Analyze your energy usage in detail to identify how much energy each process consumes within your operations. This helps prevent unnecessary energy waste and increases efficiency. By understanding your consumption patterns, you can take strategic actions and unlock new saving opportunities.

Optimize Your Facility With Per-Unit Energy Measurement

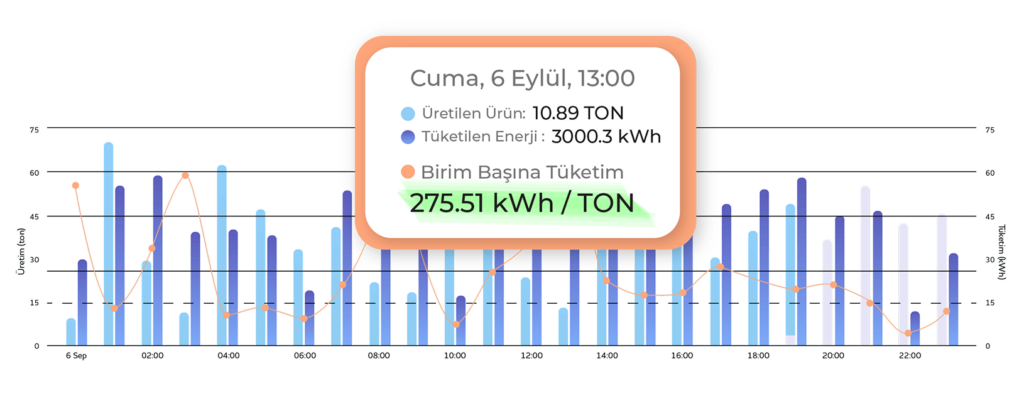
Calculate the amount of energy used per product or service to gain clearer control over your costs. Per-unit energy measurement enables you to develop more efficient production processes and boost your operational performance.

Convert Energy Consumption Into Product Value

Analyze your energy costs on a product basis and understand how these costs reflect in your pricing. By optimizing energy usage, you can increase the value of your products and build a stronger competitive advantage. Efficient energy use forms the foundation of a sustainable business model.

Maximize Profit With Per-Unit Cost Calculation

By accurately measuring energy consumption, you can optimize per-unit costs and increase profitability. Reducing the energy required in production directly translates into cost savings and higher profit margins.

Define and Characterize Your Energy Consumption Patterns!

Working in integration with variables that affect efficiency, Enerify analyzes your energy consumption and defines the electrical consumption characteristics of your facility.

Define and Characterize Your Energy Consumption Patterns!

Optimize your energy consumption and boost your facility’s performance.

Categories
Innovations

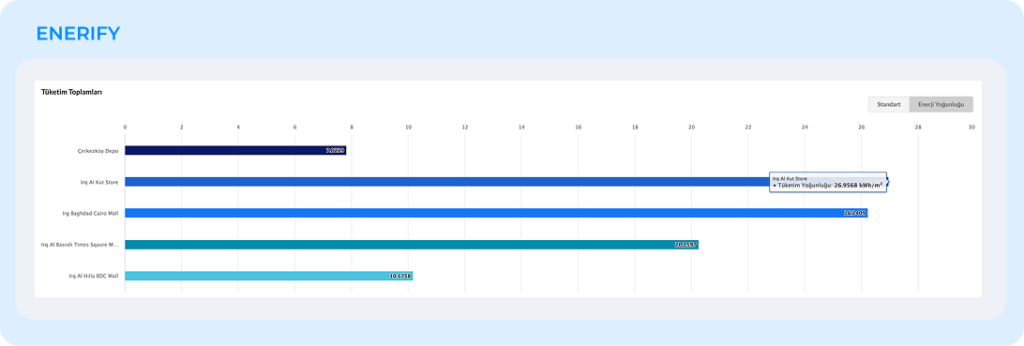
Your Enerify Consumption Map is Now More Powerful and Detailed!

The Enerify Consumption Screen you were previously informed about is now even more powerful!

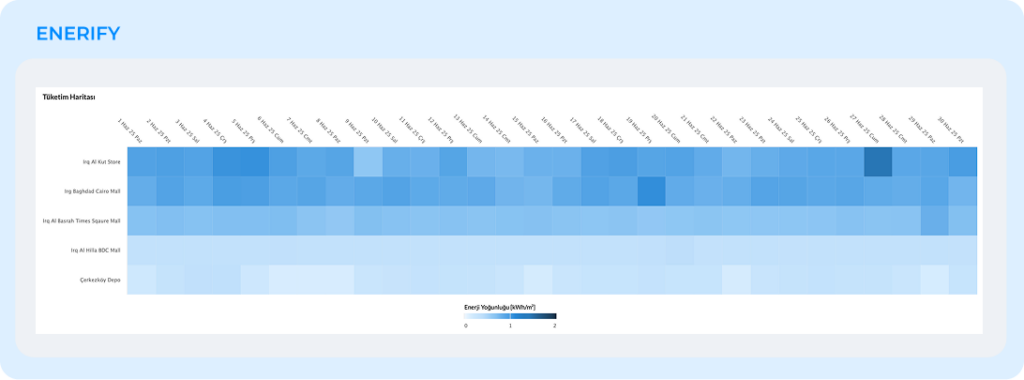
You can now easily compare all your consumption points based on energy intensity (kWh/m²) according to each facility’s area size.

This allows you to:

  • Clearly identify which location is operating more efficiently
  • Instantly detect your saving potential
Your Enerify Consumption Map is Now More Powerful and Detailed!

With the renewed daily consumption map, you can now track energy usage day-by-day within a monthly period, and hour-by-hour within a daily period — allowing you to easily identify change patterns and consumption trends.

Discover Enerify’s advanced consumption analytics now — for a more efficient energy management experience!

Categories
Innovations

AMR Configuration is Now Easier Than Ever!

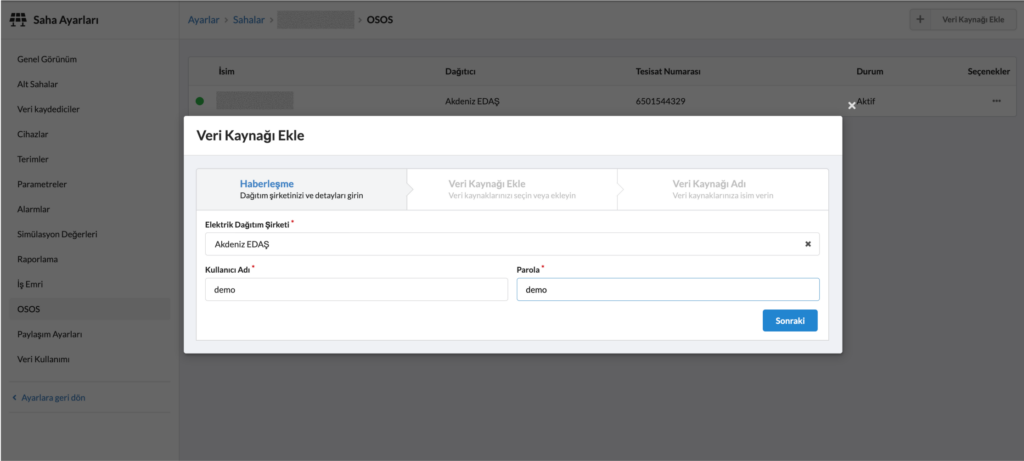
With the new update, you can now access your entire AMR list using just your username and password!

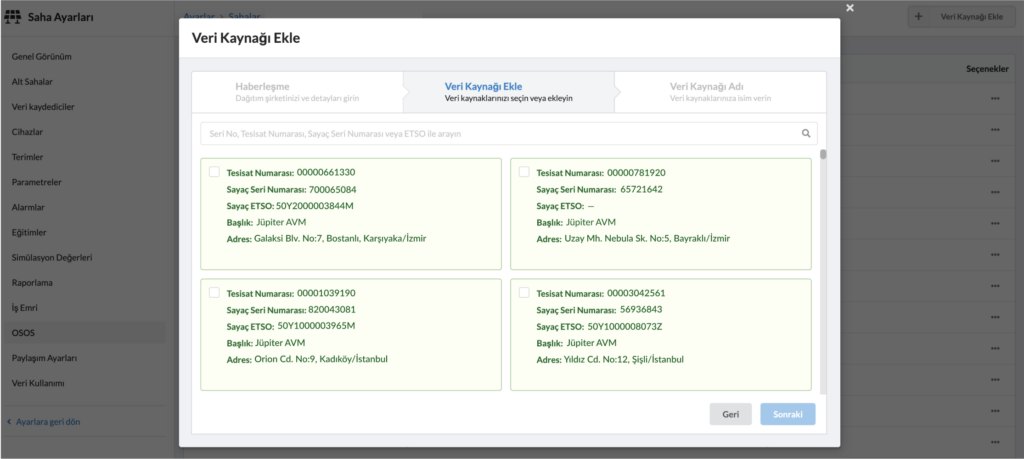
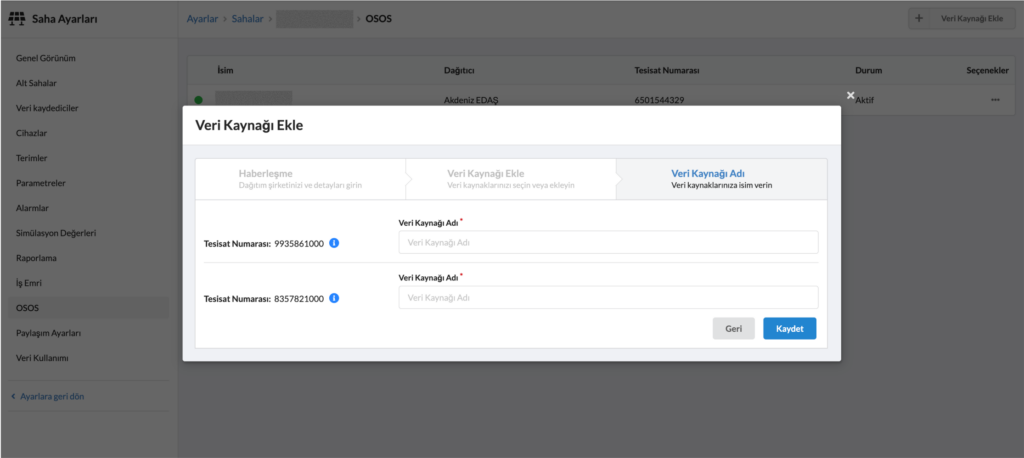
All subscriptions registered in the system are automatically displayed — all you need to do is select and save.

AMR Configuration is Now Easier Than Ever!

Especially for businesses with multiple data points, managing dozens of AMR subscriptions has now become much more practical and time-saving.

Additionally, you can view the technical details of each selected meter directly from the same screen.

AMR Configuration is Now Easier Than Ever!

Get in touch with us to discover this new feature and learn more!

Categories
Innovations

AMR Data is Now in the Pages Tab!

With our latest update, you can now include your AMR (Automatic Meter Reading System) data directly in the Pages tab.

This allows you to view and manage all your energy consumption points in detail from a single screen.

AMR Data is Now in the Pages Tab!

Analyzing your energy data is now easier than ever!

  • Access all site data from a single panel
  • Gain comprehensive analytical insights
  • Save time and reduce manual effort
AMR Data is Now in the Pages Tab!

Manage your data smarter and accelerate your decision-making processes!

Categories
Innovations

A New Era in AMR Data Loss Visualization: Annual and Monthly Analysis — Now Combined!

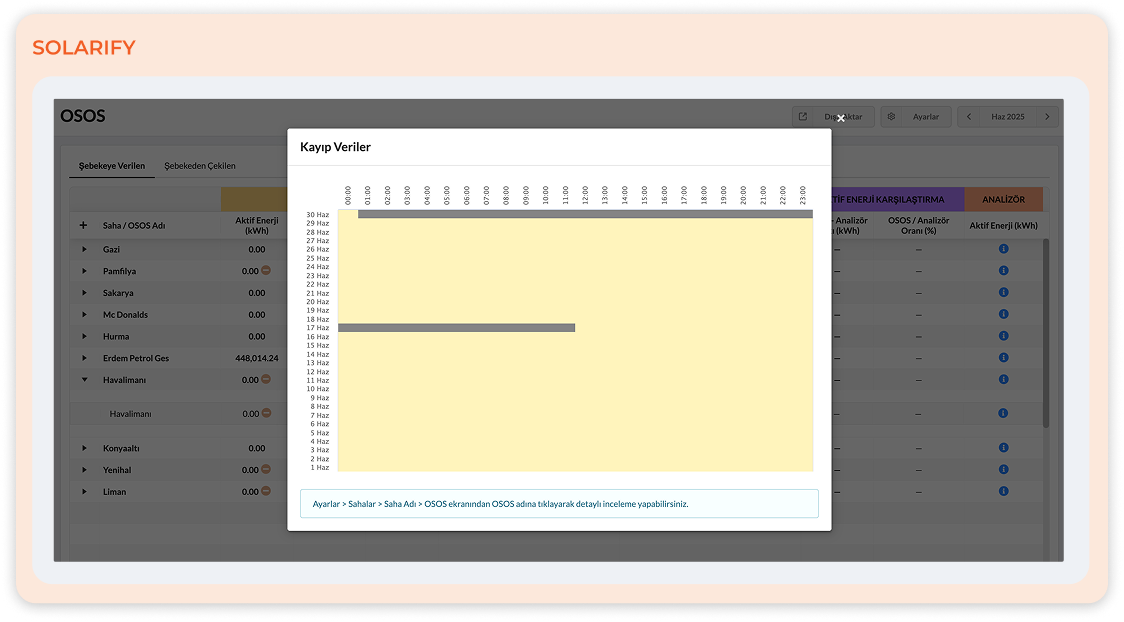
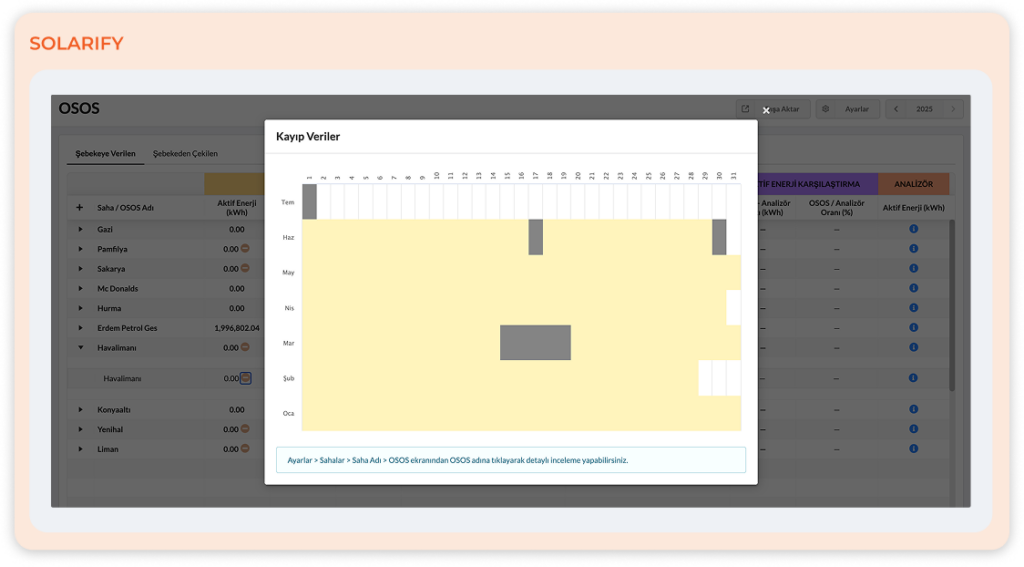
You can now view AMR data losses not only on a daily or monthly basis but also through combined annual and monthly analyses.

A New Era in AMR Data Loss Visualization: Annual and Monthly Analysis — Now Combined!

With the newly developed visualization, you can:

  • Easily monitor your entire year’s data loss status on a single screen.
  • Select any month to quickly access its daily and hourly details.
  • Request reintegration of lost data back into the system.
A New Era in AMR Data Loss Visualization: Annual and Monthly Analysis — Now Combined!

Get in touch with us today—let’s prevent OSOS data losses together.

Keep your data complete and your analysis flawless!

Categories
Innovations

Update in the AMR Reactive Alarm Structure!

A new era in energy monitoring begins!

With the latest update on the Solarify and Enerify platforms, a significant improvement has been introduced to the reactive alarm structure for businesses that manage multiple AMR data points!

Update in the AMR Reactive Alarm Structure!

Previous State:
The system used to generate a single alarm by considering the total consumption of all OSOS points.

New Feature:
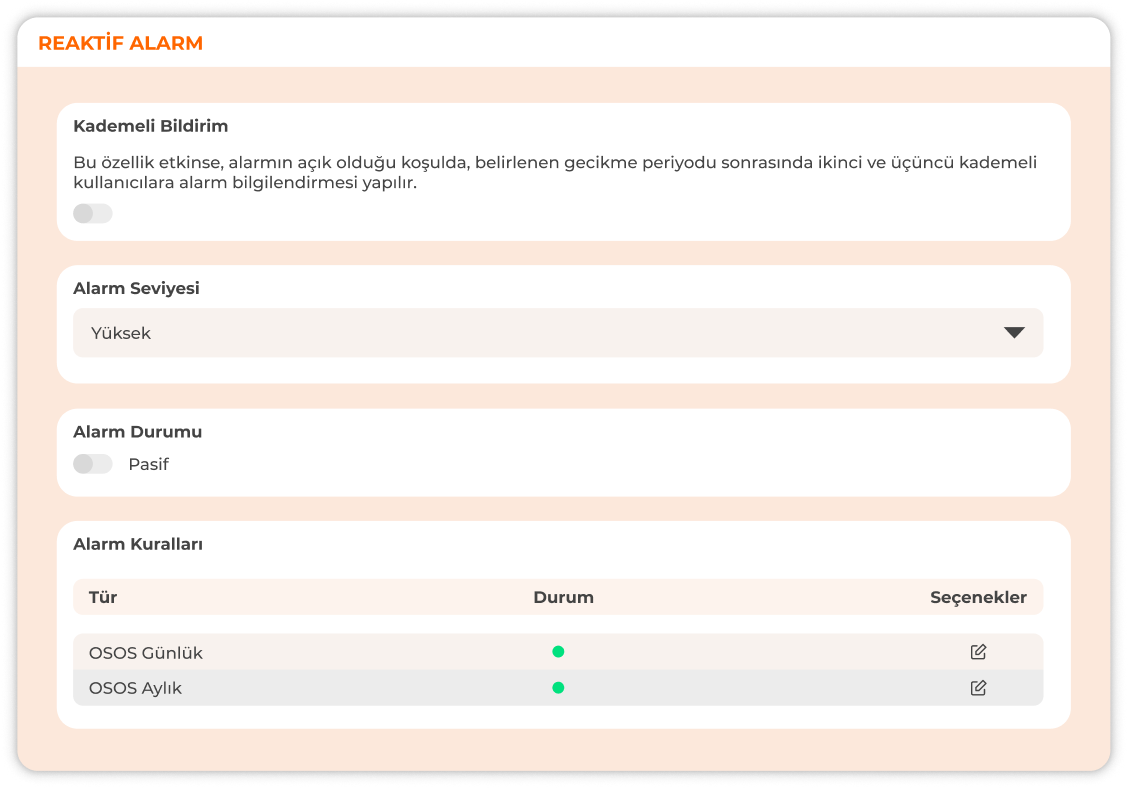
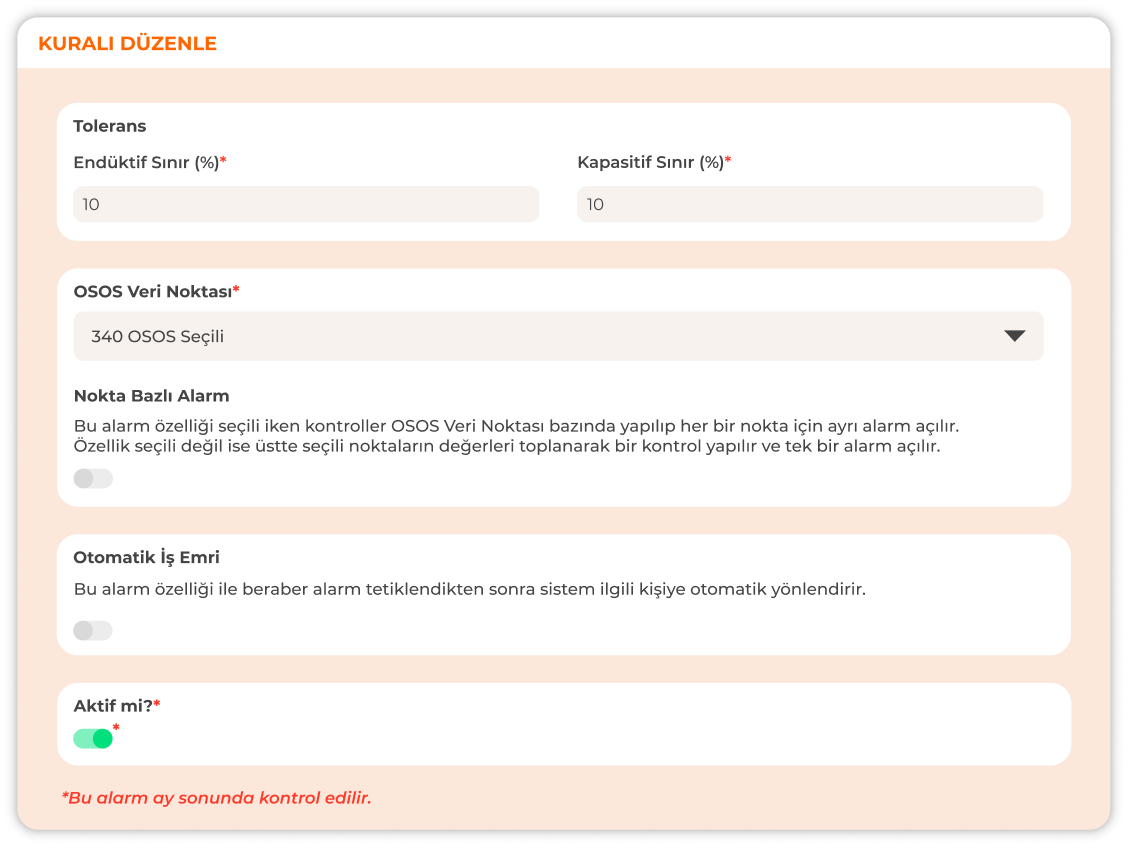
You can now activate the “Point-Based Alarm” option to individually evaluate the reactive consumption of each AMR data point, allowing you to monitor reactive balance across your sites with much higher precision and detail.

Activating the New Alarm Setup Is Simple:
Just go to the “Settings” tab in your LOGGMA panel and:

  • Select the site you want to monitor,
  • Choose the alarm type (AMR Daily or AMR Monthly),
  • Select the data points you want to include,
  • And activate the Point-Based Alarm option.

    That’s it! Your alarm is now active and ready to monitor in real time.

    Update in the AMR Reactive Alarm Structure!

    This update enables sites with multiple AMR data points to manage their energy operations with greater detail and control.

    As a result, unnecessary penalties are avoided, and operational efficiency is significantly improved.

    For more information or to activate this feature in your account, feel free to contact us.

    Categories
    Innovations

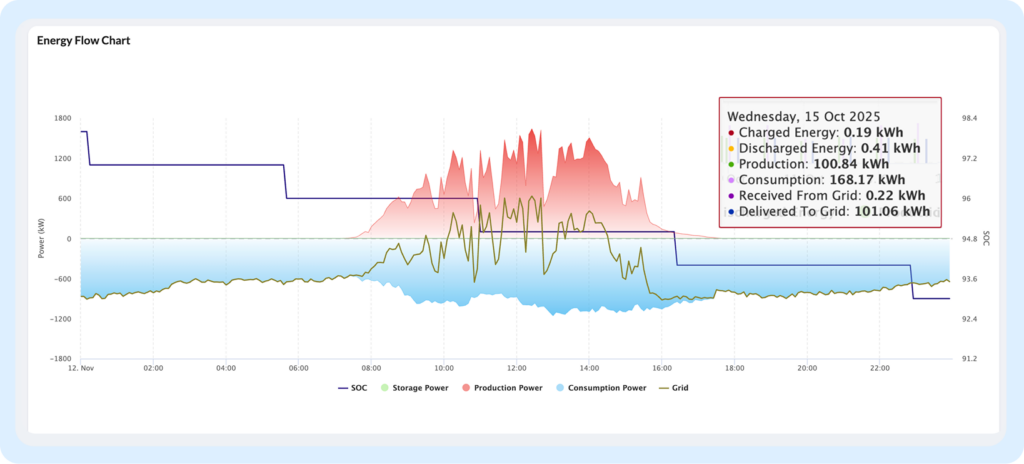
    A New Era for Rooftop PV Plants with Solarify & Enerify

    Production, Consumption, and Financial Tracking Are Now Easier Than Ever!

    A New Era for Rooftop PV Plants with Solarify & Enerify

    Finance Module Update:
    With the latest update, facilities that own rooftop PV systems under the 5.1.c regulation can now manage their settlement processes much more efficiently and transparently through the Solarify Finance Module.

    A New Era for Rooftop PV Plants with Solarify & Enerify

    Look to the future with energy: with the joint power of Solarify & Enerify, we’re launching a revolutionary new era for rooftop PV systems.

    Now, both your production–consumption data and financial processes can be managed from a single interface — with maximum efficiency and transparency.

    Don’t miss this innovation — take your facility to the next level.